
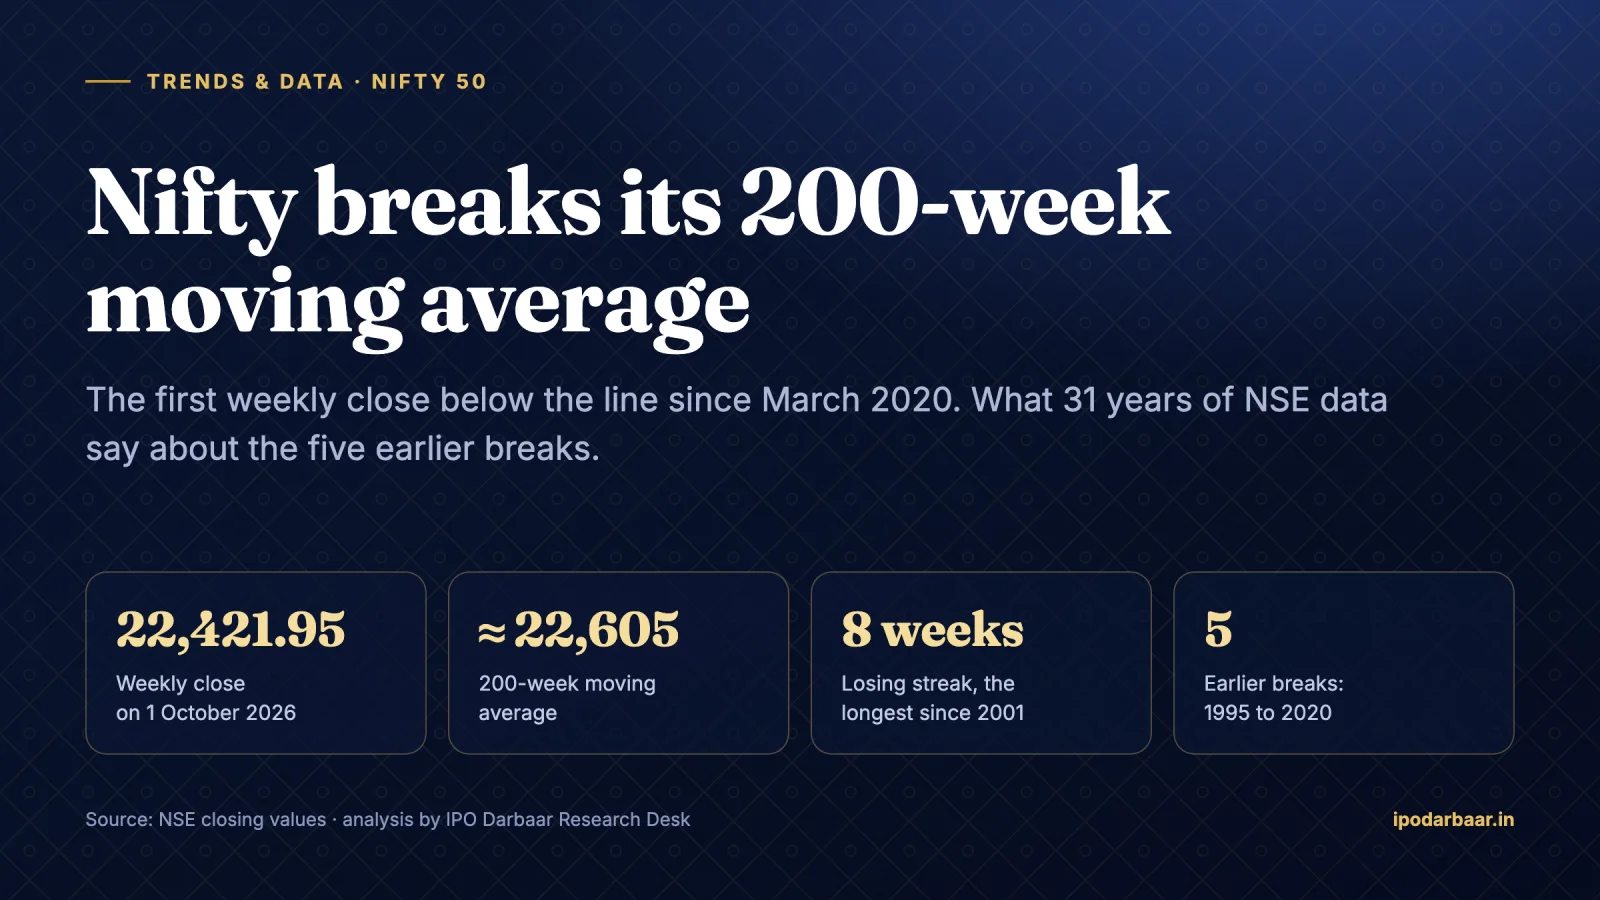
- Nifty closed the week of 1 October at 22,421.95, below its 200-week moving average of about 22,605, the first such close since March 2020
- It was also the eighth straight weekly fall, the longest run since 2001, leaving Nifty 14.8% below its January record
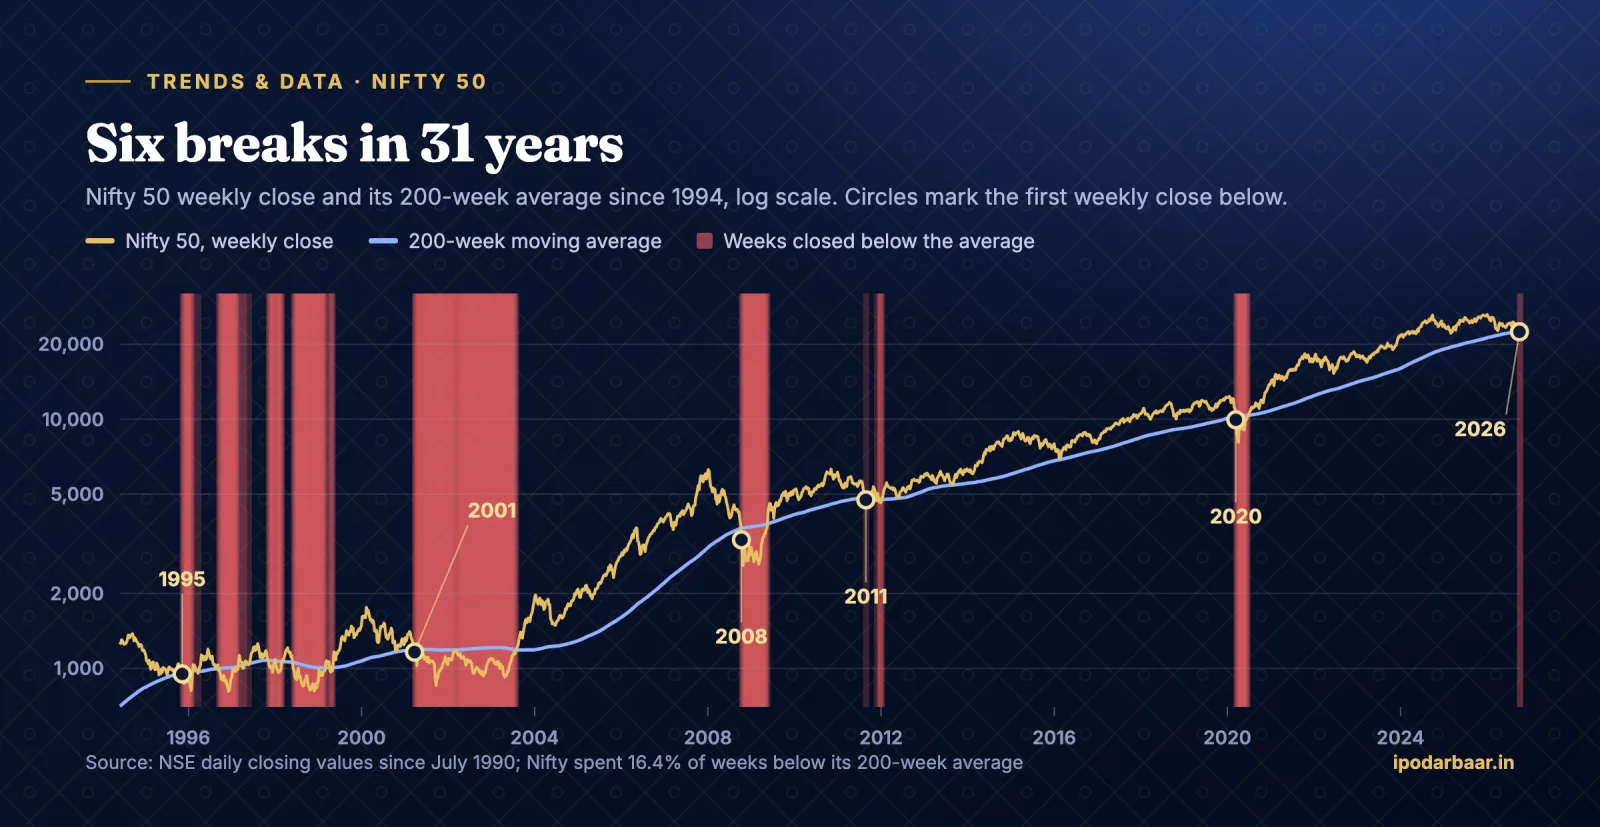
- There were only five earlier breaks: 1995, 2001, 2008, 2011 and 2020
- After four of them Nifty fell another 14–26%; three years later it was higher in four of the five
- The average is rising about 23 points a week, so the level to reclaim will be near 22,700 by the end of October
- Treat the break as a reason to manage risk, not as a forecast of a crash
In this post
- What is the 200-week moving average?
- Where Nifty stands now
- The five earlier breaks, and what came next
- Is 2026 like 2008 or 2020?
- Why 22,600 matters, and why the target keeps moving
- What long-term investors can do
- What traders should watch
- What it means for IPO investors
- The bottom line
- Frequently asked questions
The Nifty 50 ended the week of 1 October 2026 at 22,421.95. That is below its 200-week moving average, which sits at about 22,605. It is the first weekly close under this line since March 2020, when Covid sent markets into free fall. On Monday, 5 October, Nifty recovered 0.6% to 22,555.75, but it is still below the line.
The break came at the end of a bad run. It was Nifty's eighth weekly fall in a row, the longest losing streak since 2001, and it took the index 14.8% below its record close of 26,328.55, set on 2 January 2026.
A long-term average being broken makes for alarming headlines, so we went to the source. We took every daily closing value of the Nifty 50 that NSE publishes, going back to July 1990, worked out the 200-week average ourselves and looked at what happened after each earlier break. There have been only five since 1995. Their record is mixed: more pain in the short run was common, but most of them ended well for patient investors. The details are below.
What is the 200-week moving average?
The 200-week moving average (200-WMA) is the average of the last 200 weekly closing values of an index or a stock:
200-week moving average = sum of the last 200 weekly closes ÷ 200
Two hundred weeks is close to four years, so the line moves slowly. Short-term averages such as the 20-day, 50-day or 200-day moving average react to every sharp move; the 200-week average smooths almost all of them out and shows the market's long-term direction instead.
That is why it is used as a trend filter. While Nifty stays well above the line, the long-term uptrend is intact. When Nifty closes below it and stays there, the question becomes whether the long-term trend itself is turning. The weekly close is what counts: dipping under the line during a session and recovering by Friday is noise, while a weekly close below it is a signal.
Where Nifty stands now
| Measure | Value |
|---|---|
| Weekly close, 1 October 2026 | 22,421.95 (down 3.1% for the week) |
| 200-week moving average | About 22,605 (our calculation: 22,604.79; technical analysts quoted 22,606.97) |
| Gap to the line at the weekly close | 0.8% below |
| Close on Monday, 5 October | 22,555.75, still 0.3% below |
| Record close | 26,328.55 on 2 January 2026; Nifty is 14.8% below it |
| Weekly losing streak | 8 weeks, down 8.7% from 24,570.65; the longest since 2001 |
| Nifty P/E (NSE, 5 October) | 19.3 |
| India VIX (5 October) | 14.67; the 52-week high is 28.91 |
Different platforms show slightly different values for the average, depending on which day they treat as the weekly close and how far back their data goes. A gap of a few points is normal; what matters is that every version puts the line at around 22,600.
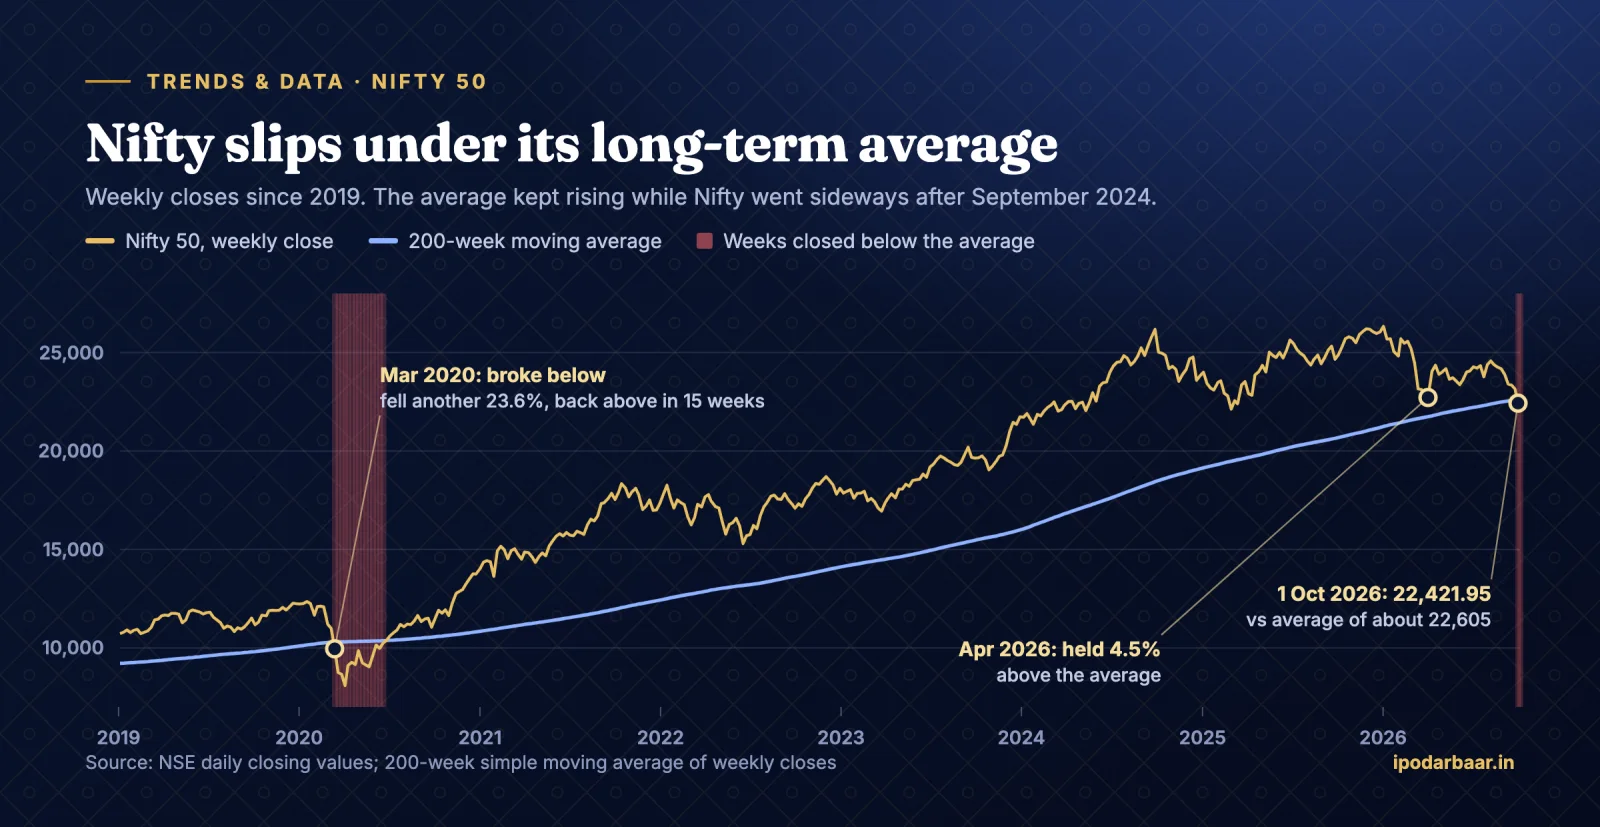
Time did as much damage as price
The chart shows something the headlines miss. Nifty fell to similar levels in March this year: its weekly close on 2 April was 22,713, and it closed as low as 22,331 on 30 March. Back then the 200-week average was about 21,740, so the index was still 4.5% above it, and it bounced.
Six months later Nifty is at about the same level, but the average has risen by roughly 860 points and caught up with it. The reason is that Nifty has gone nowhere for two years. Its first peak, 26,216 in September 2024, was 42% above the 200-week average. Its second, 26,328 in January 2026, was only 24% above it. Each week, a weekly close from 2022, when Nifty was around 18,000, drops out of the average and a close from 2026 replaces it, so the line keeps climbing even when the index stands still.
The five earlier breaks, and what came next
We counted a break as the first weekly close below the 200-week average after at least six months of weekly closes above it. By that rule, Nifty has broken its 200-week average five times before:
| Break (first weekly close below) | Fall from the record at the break | Further fall to the low within a year | Weeks to the first close back above | Nifty one year later | Nifty three years later |
|---|---|---|---|---|---|
| 10 Nov 1995 | -31.5% | -14.1% | 13 | -7.2% | -11.4% |
| 23 Mar 2001 | -33.9% | -26.4% | 50 | -2.0% | +48.5% |
| 10 Oct 2008 | -47.8% | -23.0% | 32 | +50.8% | +49.0% |
| 26 Aug 2011 | -24.8% | -4.3% | 1 | +13.5% | +66.7% |
| 13 Mar 2020 | -19.5% | -23.6% | 15 | +51.0% | +74.9% |
| 1 Oct 2026 | -14.8% | ? | ? | ? | ? |
All returns are measured from the weekly close on the day of the break and exclude dividends.
- 1995: the boom that followed the 1991 reforms had faded and the market drifted lower. Nifty fell another 14% to its low in January 1996, climbed back above the line in February, then slipped under it again and again until 1999. Three years after the break, it was still lower.
- 2001: the dot-com bust, a stock market scam that broke in March 2001 and then the 11 September attacks pushed Nifty down another 26% to its low on 21 September 2001. It took almost a year to get back above the line, and it fell below again before the 2003 bull market began.
- 2008: during the global financial crisis, the line only broke after Nifty had almost halved from its January 2008 peak. The index fell another 23% to its low on 27 October 2008, and the general election result in May 2009 lifted it back above the average.
- 2011: the euro-zone debt crisis, the downgrade of US government debt and high interest rates at home brought Nifty to the line. It got back above it within a week, crossed below it a few more times until January 2012, and never fell more than 4.3% below the break.
- 2020: the Covid crash took Nifty through the line in March. It fell another 24% in ten days, to its low on 23 March, and was back above the average by the end of June.
What these five breaks have in common
- The break rarely marked the bottom. In four of the five cases, Nifty fell another 14% to 26% before it found a low. Only in 2011 was the extra fall small.
- Getting back above the line was messy. In 1995, 2001 and 2011 Nifty climbed back above the average and then slipped below it again. One good weekly close was not the all-clear.
- Patience paid, most of the time. Three years after the break, Nifty was higher in four of the five cases, by 49% to 75%. The exception, 1995, came before a long, flat market that lasted until 1999.
- Five cases is a tiny sample. Each break had a different cause, and none of them is a template for this one. Treat the table as context, not a forecast.
Is 2026 like 2008 or 2020?
So far, no. Nifty has fallen less from its record before breaking the line (14.8%) than in any earlier case, where the falls were between 19.5% and 47.8%. That cuts both ways. It may mean the correction has further to go, or it may simply mean the line was caught by time, as explained above, rather than by a crash.
The other differences:
- A slow fall, not a panic. Nifty lost 8.7% over eight weeks, a little over 1% a week. India VIX, the market's fear gauge, is at 14.67, far below the levels seen in the 2008 and 2020 crashes.
- Large companies are taking the hit. Over the past year, the Nifty 50 is down 9.4%, but the Nifty 500 is down only 4.6%, and the Nifty Midcap 100 and Smallcap 100 are up 2.8% and 7.1% (NSE data, 5 October). The selling has been heaviest in the big companies where foreign investors hold the largest stakes.
- Valuations are more reasonable. Nifty trades at a P/E of 19.3, against 27.9 for the Midcap 100 and 37.5 for the Smallcap 100. Large caps have become relatively cheaper, while smaller companies have held their valuations.
The reasons reported for the fall are familiar ones: heavy selling by foreign portfolio investors (more than ₹2.3 lakh crore in 2026 so far, already more than in the whole of 2025), high crude oil prices, a weaker rupee, rising global bond yields and geopolitical risk. Interestingly, foreign investors kept putting money into IPOs while they sold listed shares: they invested more than ₹2,700 crore through the primary market in the first three weeks of September.
Why 22,600 matters, and why the target keeps moving
Before the break, the 200-week average acted as a floor. After a break, an old floor often becomes a ceiling, as sellers who missed the exit use any rally back to the level to get out. So the area around 22,600 is now the first test.
The level is not fixed, though. Because the weeks dropping out of the average are from late 2022 and early 2023, when Nifty was around 18,000, the line is rising by about 23 points a week. If Nifty stayed flat, the average would be near 22,700 by the end of October and about 22,800 by the end of November. To repair the damage, Nifty has to recover a moving target.
If Nifty recovers
Two or three weekly closes back above the average would be the first sign of repair; the history above shows that a single close is not enough. It would be more convincing with more stocks rising than falling, a calmer India VIX, foreign selling easing off and the big index heavyweights joining in.
If it does not
If rallies keep stalling below the line and Nifty starts making lower highs and lower lows, the long-term picture weakens further. The levels traders will watch first are this year's lows: the closing low of 22,331 from 30 March, and the 52-week low of 22,182.55. Support levels shift with every week of trading, so treat them as reference points, not targets.
What long-term investors can do
One indicator should not drive a long-term decision. It is more useful to go through a short checklist:
- Asset allocation. If equities have grown to a bigger share of your savings than you planned, rebalancing is sensible; if they have shrunk, this is not a reason to cut them further.
- SIPs. If your goals and time horizon have not changed, a falling market means your SIP buys more units. The three-year returns in the table above are a reminder of how earlier breaks played out for patient investors.
- Quality of what you own. Check debt levels, earnings and valuations in your portfolio. Weak companies tend to fall further and recover more slowly than strong ones.
- Concentration and leverage. Avoid borrowing to invest and avoid large bets on single stocks or sectors while volatility is rising.
- Emergency money. Keep money you may need within a year or two out of equities altogether.
What traders should watch
- The weekly close. Friday's close (Thursday's in a holiday week) against the rising average counts for more than any move during the week.
- The average itself. It is climbing by about 23 points a week, so recheck the level every week rather than fixing on 22,600.
- Market breadth. A rally led by a handful of heavyweights while most stocks lag is weaker than one where most stocks rise.
- India VIX. A jump in volatility means bigger swings in both directions and a higher risk of stop losses being hit.
- Foreign flows. Foreign selling has been the main pressure on large caps this year. A sustained change in that trend would matter more than any single indicator.
Common mistakes with the 200-week average
- Treating it as an automatic buy or sell signal. It is a trend filter; Nifty has both bounced straight back from a break (2011) and stayed under the line for almost a year (2001).
- Reacting to intraday moves. Nifty went under the line during trading on 29 September; only the weekly close on 1 October confirmed the break.
- Assuming the level is fixed. As shown above, the average moves up every week.
- Using it alone. Earnings, valuations, interest rates and fund flows explain more about where markets go next than any one line on a chart.
What it means for IPO investors
A weak market shows up in IPO listings quickly. On our data, the 16 mainboard IPOs that listed in August 2026 all opened at a premium, with a median listing gain of 22.2%. In September, as Nifty kept falling, 19 of 30 listed at a premium and the median gain fell to 8.3%. In the March 2026 sell-off, the seven mainboard listings lost 5.9% on average.
When the market is under pressure, the grey market premium and the subscription figures matter more than usual. Our live IPO GMP page tracks them daily, and the GMP accuracy tracker shows how often the GMP has called listings correctly. The biggest test of demand is still ahead: the Jio Platforms IPO, expected in the second half of October, will be the largest IPO in India's history and will open with Nifty near this line. You can see what else is coming on the upcoming IPO list and our IPO report card of listing gains.
The bottom line
Nifty's first weekly close below its 200-week average in more than six years is a real warning about the long-term trend. History says such breaks have often been followed by more weakness, and that getting back above the line can take weeks or months and several false starts. It also says that over three years, four of the five earlier breaks turned out to be good times to stay invested.
This time the fall has been slower and shallower than in the crashes of 2008 and 2020, and the line was hit partly because the market has gone sideways for two years. Watch the weekly close against a line that is rising about 23 points a week, respect the extra risk, and avoid big decisions based on one indicator.
Frequently asked questions
What does it mean when Nifty falls below its 200-week moving average?
It means the index has closed a week below the average of its last 200 weekly closes, roughly four years of data. A sustained move below the line suggests the long-term uptrend is weakening; a quick recovery above it weakens that signal.
What is Nifty's 200-week moving average now?
About 22,605 at the weekly close on 1 October 2026. Because older, lower values keep dropping out of the calculation, it is rising by about 23 points a week and should be near 22,700 by the end of October.
When did Nifty last close below its 200-week moving average?
In March 2020, during the Covid crash. Nifty first closed a week below the line on 13 March 2020 and closed back above it at the end of June 2020. It stayed above the line for more than six years after that.
How did Nifty do after earlier breaks?
There were five breaks before this one, in 1995, 2001, 2008, 2011 and 2020. In four of them Nifty fell another 14% to 26% before bottoming. One year after the break, Nifty was higher in three of the five cases; three years after, in four of the five, by 49% to 75%.
Is a break below the 200-week moving average always bearish?
It is a bearish technical signal, but not a guarantee of a long bear market. In 2011, Nifty was back above the line within a week. The signal gets stronger the longer the index stays below the line and the more rallies fail there.
Should I stop my SIP because Nifty broke its 200-week average?
We do not give personal investment advice. In general, a SIP is meant to keep buying through falling markets, and stopping it because of one indicator defeats that purpose. If you are unsure, speak to a SEBI-registered investment adviser.
Method: NSE daily closing values of the Nifty 50 from July 1990 to 5 October 2026. The weekly close is the last trading day of each week, and the 200-week average is a simple average of the last 200 weekly closes. Figures may differ slightly from other platforms. Market context is from NSE data and reports quoting NSDL, Reuters and PTI. This post is for information only and is not investment advice.
For information and education only; not investment advice. Figures come from offer documents, exchange and SEBI filings and IPO Darbaar data as of the date of publishing. Grey market premium (GMP) is unofficial.